Who?
For every business leader who wants clarity and control.
Empower your team with the right insights to lead with confidence.
You're in control of your business.
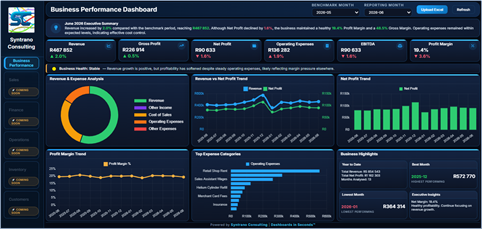
Upload your transaction records, financial data or exports from your existing business software and instantly receive a professional Business Performance Dashboard — no Power BI, no coding and no technical expertise required.
The story behind your numbers
Every business has a story. Your data tells it. Dashboards in Seconds™ helps you understand it.
Every month tells part of your business story. The real value comes from connecting those months together to understand where you've been, where you are today and where you're heading next.
The businesses that scale successfully are not always those generating the highest revenue. They are the businesses that understand their numbers, recognise emerging trends and make informed decisions before small issues become major problems.
Revenue is what you earn. Profit is what you keep. Insight is what helps you improve both.
The 5 W's of Dashboards in Seconds™
Instant insights. Smarter decisions. Better results.
For every business leader who wants clarity and control.
Empower your team with the right insights to lead with confidence.
You're in control of your business.
Instant, visual insights on performance, trends and comparisons.
See what's working, what's not, and where to take action.
All your data. One powerful view.
To make better decisions. Faster.
Spot opportunities, fix issues and boost profit with real-time insights you can act on.
Clarity today. Growth tomorrow.
Anywhere. Anytime.
Works offline. On your laptop. On your terms.
Your data stays yours. You stay in control.
When you need answers that drive action.
No waiting. No complex setups. Upload, analyse and decide — in seconds.
Real-time insights. Real-time impact.
That's the power of Dashboards in Seconds™.
In today's world,
You can't afford to be left in the dark. Your business deserves better.
Why Dashboard in Seconds
Every business generates valuable information every day — sales, expenses, customers and transactions. For most organisations that information stays locked in spreadsheets and system exports. We built Dashboards in Seconds™ so any organisation gets professional business intelligence without a BI project, a licence stack or a consultant.
Hours lost to manual reporting. Expensive BI licences and specialist skills. Month-end numbers that arrive too late to act on. Reports that only show one month at a time. Data that has to leave your device to be analysed.
Any organisation — small or large — that wants business oversight and insight from the data it already has.
Features
Twelve capabilities that normally take a BI team a quarter to deliver — included from the moment you open the file.
One clear view of the whole business.
Track revenue by period, product and channel.
Gross, operating and net margin at a glance.
Compare performance against prior periods.
A single score with the drivers behind it.
Filter, slice and drill without formulas.
Top customers, segments and concentration risk.
Spot direction early with rolling trends.
Reads beautifully on laptop, tablet and screen share.
Your data never has to leave your device.
No licences, no gateways, no IT tickets.
Drop in your data export — the dashboard does the rest.
More than a dashboard
Most reporting tools give you a snapshot of a single period. A single month rarely tells the whole story. Real business intelligence comes from understanding how your business evolves over time.
Your workbook is not a one-time upload — it becomes your historical business performance database. Each month you add your latest transactions and records, and the value of your dashboard grows with it.
Compare reporting periods, analyse trends, monitor profitability, identify seasonal patterns and evaluate the impact of decisions over time.
Instead of asking “What happened this month?” you start asking:
Every month adds another chapter to your business story.
Who it's for
Whether you are an entrepreneur launching your first venture, a business owner managing day-to-day operations, a finance manager preparing monthly reports, an accountant or bookkeeper supporting clients, an operations manager driving efficiency or an executive responsible for strategic direction, this dashboard has been designed to help you better understand your business.
Launching your first venture and need to see traction clearly.
Managing day-to-day operations without losing sight of the numbers.
Preparing monthly reports in minutes instead of days.
Supporting clients with reporting they actually understand.
Driving efficiency by seeing where money quietly leaves the business.
Responsible for strategic direction and long-term performance.
Because better information leads to better decisions.
Starting out? Running a small business?
You don't need a finance team or years of experience. If you're learning to read your numbers or running a smaller operation, the same clarity applies.
Just starting out and learning what your numbers mean? Build confidence early by seeing your business story clearly from day one.
Running an SME without a dedicated analytics team? Get the oversight you need to compete, grow and make informed decisions every month.
How it works
No implementation project. No training programme. Most customers are looking at their first dashboard within a minute of downloading.
Secure one-time checkout. No subscription.
Check your email inbox for an email with your downloads.
Launch the file — nothing to install.
Transaction records, financial data or exports from your existing business software.
Your dashboard renders in seconds.
Live preview
Real screens from the Business Performance Dashboard.
Our principles
Understanding where money is being lost is often just as valuable as understanding where it is being earned.
Quality business intelligence should be available to organisations of every size — not only those with large budgets or dedicated analytics teams.
No databases. No lengthy implementation projects. No specialist technical knowledge. Maintain your workbook, upload your data and start analysing within seconds.
Move beyond static reports by comparing periods, identifying trends, understanding profitability and recognising opportunities for improvement.
Present performance through a polished Business Intelligence Dashboard with interactive visualisations, summaries and meaningful KPIs.
The purpose of business intelligence is not simply to report — it is to support better decisions, monitor performance and act with confidence.
What's included
Pricing
No seats, no monthly licence, no renewal surprises.
Dashboard in Seconds™
Launch offer · First 50 customers
Introductory price for the first 50 customers. Normal price R2,499.
Secure checkout · Instant download · 14-day refund policy
Testimonials
“We replaced a three-day month-end reporting cycle with a single upload. The board pack now builds itself.”
“I'm not technical and I had a full business dashboard on screen in under a minute. That's the whole pitch, and it delivers.”
“The benchmark and profitability views gave us conversations we simply weren't having before.”
Product suite
Start with Business Performance today. Every future release is built on the same one-click data workflow.
Available now — revenue, gross profit, operating expenses, EBITDA, net profit and margin trends in one view.
In development. Join the waitlist to be notified the moment it ships.
In development. Join the waitlist to be notified the moment it ships.
In development. Join the waitlist to be notified the moment it ships.
In development. Join the waitlist to be notified the moment it ships.
In development. Join the waitlist to be notified the moment it ships.
FAQ
About
To make professional, executive-level business intelligence accessible to every organisation — regardless of budget, headcount or technical skill.
A world where every leader can see the true state of their business in seconds, and act on it with confidence.
Business intelligence and analytics, AI consulting, and digital transformation for owner-managed businesses and corporate finance teams.
Support
Log a request through our support portal — scan the QR code, open the link, or submit the form below and a Syntrano specialist will respond within one business day.

Scan the code or open the link to reach our support portal — no email needed.
Coming soon
Business User Guide & Quick Start Guide included in every purchase
One-time purchase. Instant download. Revenue is what you earn, profit is what you keep — insight is what helps you improve both.
Buy Dashboard in Seconds™